Step 1
Show the participants a completed 3 colour map, and show them a blank example on the pieces of paper. Ask them to colour in the blank map such that no 2 regions that are next to each other have the same colour, while attempting to use the least number of colours they can.
Step 2
After they have finished, Ask each participant how many colours each of them used.
Step 3
Compare the differences between the participants’ colourings and investigate why one obtained a more efficient colouring than the others (using less colours).
Step 4
Give the participants a blank 4-colour map this time to fill in, and get them to try again still- using the least number of colours they can.
Step 5
Ask whether they are using any form of method to colour in the maps, or whether they can find any procedure that will help them colour in the map with the least number of colours.
Step 6
After repeating Step 3 with the new maps, ask the participants what is the least number of colours needed to colour a map, using their colourings as a reference.
Step 7
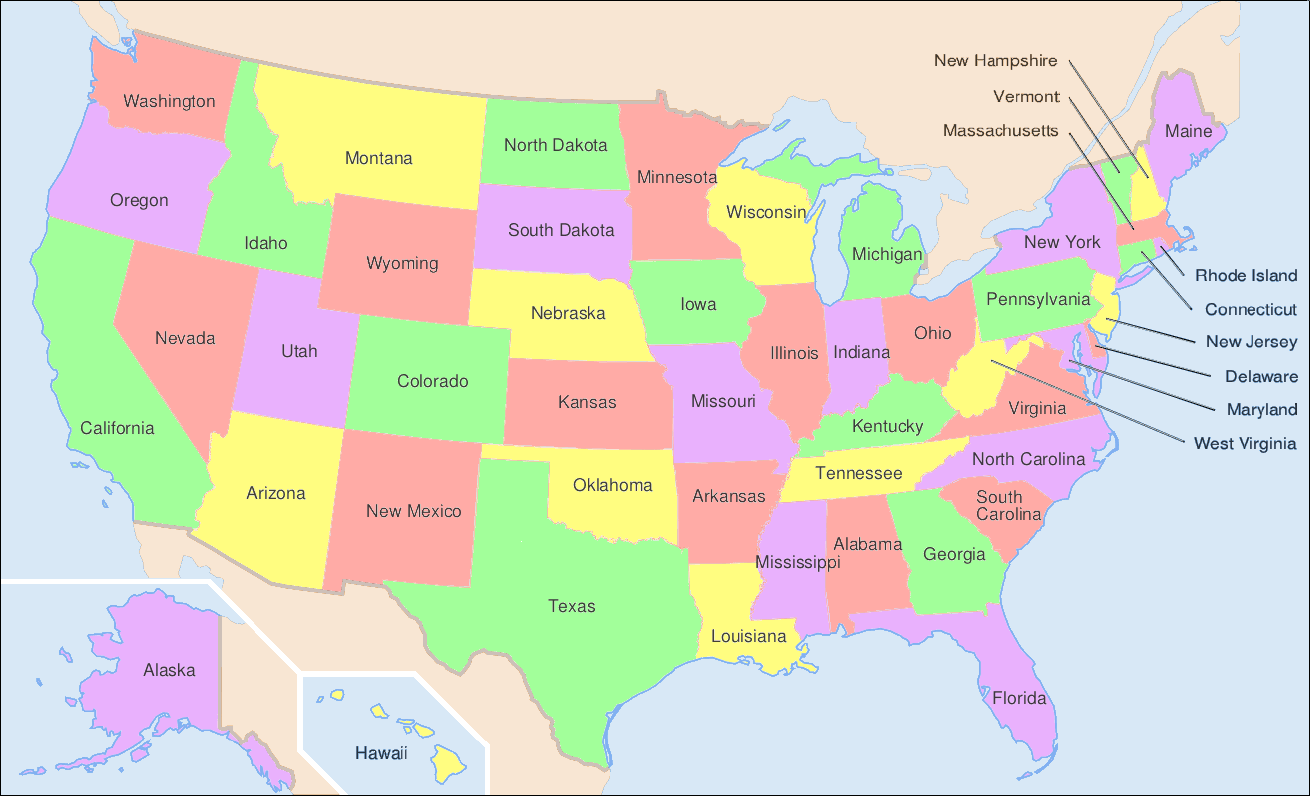
As a hint, the demonstrator can print a complicated looking map (e.g. the U.S.) and show them another print out with the map completely coloured in with only 4 colours. Ask again whether they are able to propose a possible result on the least number of colours with this insight.
Step 8
Explain the 4 colour theorem and its background.
Step 9
Allow any participants to try their hand at colouring in some complicated maps, using only 4 colours.
To make the activity shorter: Start off with a more complicated map, skipping out the simplified map that requires only 3 colours.
Crayons may pose as a choking hazard to infants.
Imagine you are a map maker and you would like to colour in a map of several countries. The only problem is that you have a limited number of colours at your disposal and so you can not colour every country a different colour. You would also like neighbouring countries to be a different colour. Otherwise, your readers may get confused whether they are separate, or the same country. How can you find out what number of colours you need to do this? Is it the same for every map?
How many colours do you need to colour in any map?
Just four or less!
Can I colour it with more than 4 colours?
Yes, you can. You could colour every region a different colour if you’d like. But we are trying to find the least number of colours to use.
Shouldn’t different maps have a different number of minimum colours needed to fill them in?
Yes. Some maps may need only 2 or 3 colours. All maps could be coloured using a greater number of colours. However, what we can say is that you only need 4 colours to colour any map, no matter how complicated the map is!
Is there a map that needs 5 colours and not less?
No. This is what the 4 colour theorem says and proves. If you give me a map that is coloured with 5 colours, I can assure you that you can colour it with only 4!
I wasn’t able to colour a map with 4 colours, I needed more. Doesn’t this prove you wrong?
The great thing about Mathematics is that when a result has been officially proved, there is no way that it can be wrong! I can be sure that if you colour the map more carefully, you’ll be able to see that it still only needed 4 colours.
The 4 colour theorem is a theorem in a field of Mathematics called Graph Theory in an area specifically allocated to Vertex Colouring. This theorem is an example of a result which is very easy to state and understand and yet its proof is immensely difficult. If you think about joining regions on a map using a network of lines, a country’s node can only be linked to 5 other nodes (bordering countries) without any lines crossing, if you have more than that the lines become tangled and the network can then no long be described as a map.
The faces of a map can be thought of as nodes (vertices) and if two regions touch on their border, then the nodes are connected by a line (edge).

Seeing the problem in this manner simplifies it greatly, and allows us to redraw the map as a graph as shown in Figure 1. Essentially, extra details are removed such as the size or shape of the country, and only the important features – such as which country is bordering it – remain.
Graphs with the special property of not having lines which intersect are called planar (see Figure 2). This type of graph uniquely represents a map of one form or another, making it an important aspect of the study of colourings.

A proper colouring is a colouring of a graph which does not allow two different nodes that are connected with one another to have the same colour. Below is an example of a proper colouring:

Although in the graph shown in Figure 3, three colours were used, you could use a different colour for A,B,C,D and E, i.e 5 colours. This naturally leads to the question, “What is the least number of colours which gives a proper colouring?”, because whereas there are numerous ways to colour a graph, there is only one way to colour it using the least number of possible colours.
Historically, it was first proved that at most six colours were needed to colour any planar graph and this was quickly reduced to only five. A suspicion was growing that this could be reduced down further to only four colours, but its mathematical proof evaded the greatest mathematicians of its time for the better part of 150+ years. It took a great deal of work in this field and the invention of the computer to check all the possible cases, and finally prove the “Four Colour Theorem”. However, initially it was accepted somewhat begrudgingly by the wider mathematical community for its first uses of a computer assisted proof.
Applications
Colouring problems have a wide variety of applications beyond just drawing shapes and colouring them. These shapes represent arbitrary objects, and so do the colours, yet the results that we mentioned hold true.
In scheduling, for example a course timetable, you may represent each course as a node and join nodes with a line if they have no student in common. If you colour the graph created, the number of colours necessary is the minimum slots needed.
http://cgm.cs.mcgill.ca/~godfried/teaching/dm-reading-assignments/Map-Graph-Coloring.pdf (pg 1-15)
Radio frequency assignment is also an interesting application of colouring. Suppose an area has several radio towers and each tower can transmit up to a certain distance. There is going to be some overlap between the broadcasting ranges of towers. These towers have to be assigned different radio frequencies if they are transmitting for different radio stations. Otherwise the stations play at the same time on the same frequency. To calculate the smallest number of frequencies required to avoid this problem, you can use graph theory. The towers are treated as the nodes and a line is drawn between them if their broadcasting ranges overlap. If you colour the graph obtained, you will find the least number of frequencies required to avoid this problem.
http://www.cs.kent.edu/~dragan/ST-Spring2016/Allocating%20radio%20frequencies%20using%20graph%20coloring.pdf
Recently very large networks have become an important area of study in neural and social sciences as well as molecular biology. It deals with graphs with thousands of nodes that can only be studied through the means of a computer.
http://cordis.europa.eu/result/rcn/191004_en.html
Research
Research in Graph theory which studies artificial intelligence, better scheduling algorithms and network models.
https://arxiv.org/ftp/arxiv/papers/1511/1511.04785.pdf
What is the least number of colours you need to colour a map?
If we made the map more complicated, do you think we would need more colours?
What about countries like the United States of America (with parts of the countries not connected by a land bridge) how does this change things?
What if you have to colour some parts of the map a certain colour (ie blue for water) how does this change things?


